
Mon, April 15, 2024
Burning Questions…
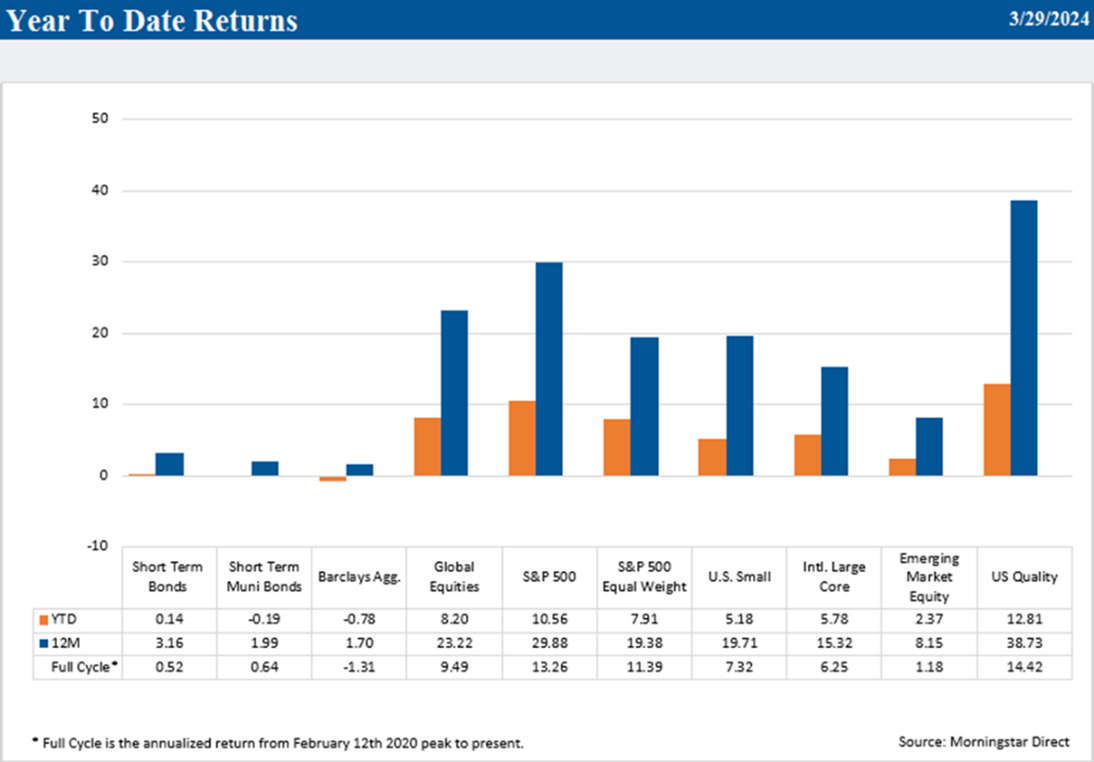
2024 picked up right where 2023 left off, with global equity markets rallying on the back of better than expected economic and corporate earnings growth and optimism for central bank easing later in the year. Late in the quarter, the S&P 500, the STOXX Europe 600, and the Japanese Nikkei 225 reached all-time highs in unison, a rare occurrence. Bonds were flat during the quarter as hotter than expected inflation data and commentary from Federal Reserve officials led investors to reset their expectations for both the timing and number of interest rates cuts this year. As a group, diversifying assets were slightly positive with strong gains from reinsurance offset in part by declines in private real estate.
Equity performance trends from 2023 persisted during the quarter with U.S. outperforming international, large cap over small cap, and growth over value, but a highlight in the first quarter was quality. The subset of large U.S. companies that exhibit higher profitability, lower leverage, and superior earnings quality and consistency outpaced both the S&P 500 and the broader Russell 3000 indices.
In last quarter’s commentary, we believed moderate growth, disinflation, and the potential for less restrictive monetary policy would continue to provide a positive backdrop for equities. While the first quarter was defined by several markets reaching all-time highs, we also believe it was a period in which several crosscurrents emerged. Most importantly, after significant progress in 2023, disinflation has clearly stalled with four consecutive months of hotter than expected CPI data. The labor market remained tight, although forward-looking indicators suggest it may downshift later this spring. Consumer loan delinquencies have ticked up. More recently, rising geopolitical risks and renewed uncertainty about monetary policy have increased volatility. These developments have left investors with key questions about the economic and market outlook for the remainder of the year.
Are we witnessing a second wave of inflation?
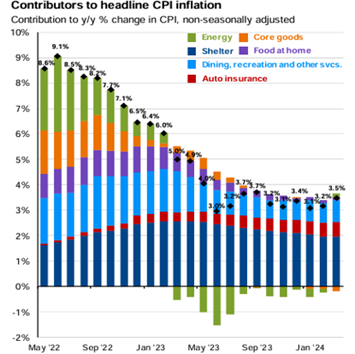
Headline CPI inflation crested at just over 9% in mid-2022 before falling consistently on a year-over-year basis to reach 3.1% in November of 2023. However, each monthly CPI measure in 2024 has been higher than anticipated with the recent March number ticking up to 3.5%. While goods inflation has remained tame, services inflation has been sticky, primarily due to shelter and wages but also because of other factors such as auto insurance and healthcare costs. The primary reason for stickier prices has thus far been a good one: better than expected economic growth despite historically aggressive monetary policy. Almost all the disinflation we have observed has been a result of improvement in supply chains. In fact, inflation peaked just after the Fed began hiking rates. We haven’t yet seen the contribution from reduced demand to lowering inflation.
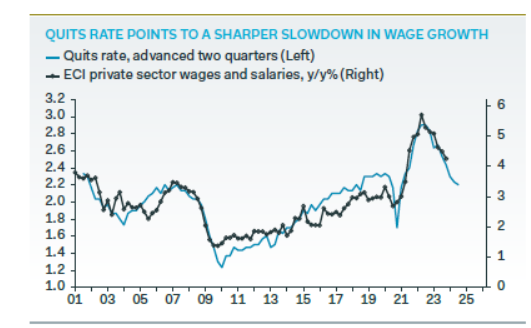
Reduced demand and the normalization of outsized increases in certain components should begin to feed through to wages and pricing data over the next few months. First, forward-looking indicators suggest wage growth should soften in the months ahead. For example, the quits rate, a metric that measures the number of people quitting their jobs, has declined significantly. Employees quit their jobs when new jobs are plentiful and offer higher wages. The quits rate spiked after Covid but has since fallen back to its pre-Covid level. Historically, a falling quits rate has correlated highly to subsequent declines in wages.
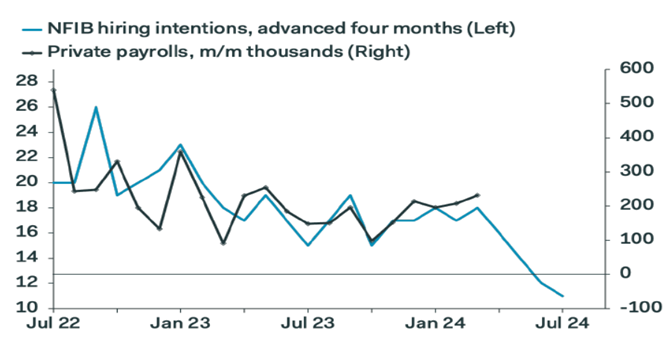
Furthermore, the National Federation of Independent Businesses (NFIB) hiring intentions and compensation surveys also imply future declines in hiring and wages. The NFIB is a widely followed non-profit that provides economic research on small businesses, which are responsible for the majority of hiring in this country. According to the March NFIB survey, just 21% of firms are planning to raise wages over the next three months, down from 30% last November. Sticky shelter inflation should also moderate over the coming months given its tight correlation with movements in rent indices such as Zillow.
Lastly, nearly half the increase in core services prices in March was due to a jump in auto insurance and repair costs. These should also moderate going forward as they typically lag new auto prices which have fallen over the last few months.
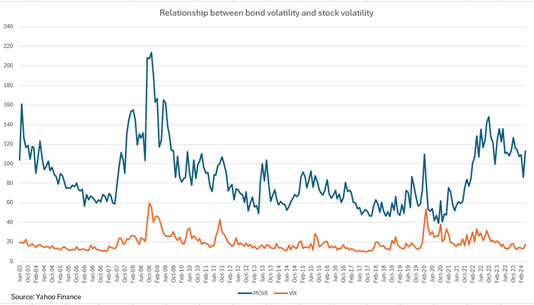
We do not believe a dreaded second wave of accelerating inflation has started but acknowledge the path to sustainable progress will take longer than originally anticipated. This development has several implications. The delay may cause renewed volatility in the bond market which often feeds into stocks. The chart below illustrates how spikes in the MOVE Index, measure of implied interest rate volatility, are often accompanied by increases in the VIX index, a gauge of expected volatility in the U.S. stock market.
Additionally, it will likely result in a longer period of restrictive monetary policy, increasing the likelihood policy weighs on labor, consumption, and economic growth. Furthermore, while yields on bonds are more attractive than they have been in years, positive total returns for fixed income may be challenging until investors receive more encouraging data on prices. Recall in last quarter’s commentary, we cautioned that the market had unrealistic expectations for monetary policy in 2024. The market has now pivoted from expecting nearly seven interest rate cuts this year to two.
Soft landing, hard landing… no landing?
Think of the U.S. economy as a plane, and the Federal Reserve Open Market Committee (FOMC) as the pilot. In 2022, The FOMC realized the plane was flying at too high an altitude to bring down inflationary pressures, thereby threatening one of their two mandates, price stability. Thus, the FOMC began to raise interest rates aggressively with the goal of lowering the plane’s altitude by reducing economic growth. Ultimately, however, any plane needs to land. A key question on investors’ minds over the last 2 years has been -what type of landing will the plane(economy) have? We analyze three potential outcomes below.
A soft landing is the FOMC (or any pilot’s) ideal outcome. In this scenario, economic growth slows enough to bring down inflation, allowing the FOMC to ease policy, but remains high enough to avoid recession. The labor market cools without a significant rise in unemployment. The plane gradually loses altitude, and the pilot sticks the runway, cruising to the gate with an economy that is neither too hot nor too cold. Not surprisingly, a soft landing is the most ideal environment for capital markets.
Soft landings are less common after aggressive monetary tightening. An old market adage says that bull markets don’t die of old age, they are killed by the Fed. Nonetheless, soft landings have occurred. For example, the Federal Reserve raised short-term interest rates from 3 to 6% in 1994, but the unemployment rate declined 0.7%. While the jury is still out, the current cycle has exhibited several elements of a soft landing. Despite the most aggressive tightening cycle since the early 1980s, economic growth has remained positive, the labor market tight, and consumer spending robust. Growth has slowed from 5% in the third quarter of 2023, to 3% in the fourth quarter, to an estimated 2.5% in Q1 2024, while the unemployment rate has only increased from 3.4% to 3.8%. Inflation has cooled, until recently. Thus far, it’s been a gradual, controlled descent.
A hard landing occurs when tight monetary policy causes a rapid shift from above trend growth to slow growth to outright economic contraction. Disinflation may occur but not without an abrupt rise in the unemployment rate. The plane doesn’t necessarily crash but certainly hits the runway with significant turbulence, perhaps skidding before its final resting spot. Also not surprising is that hard landings are the worst outcome for markets. They are usually accompanied by recessions and bear markets.
Additionally, hard landings are often catalyzed by unwinding excesses in the economy or the bursting of a large asset bubble such as the tech bubble in the early 2000s or the housing market in the mid-2000s.
Recently, more investors have warmed to a third scenario. What if the plane doesn’t land at all, or at least for a while? In a no-landing scenario, economic growth remains strong despite restrictive monetary policy. Robust growth and a tight labor market keep inflation high, forcing the Fed to remain “higher for longer” with perhaps the need to raise rates. The plane may either need to circle above the airport or find another place to land, at some unknown point in the future.
The key to which outcome prevails lies with the path of inflation. That path will likely dictate how long rates stay in restrictive territory and how much flexibility the Fed will have to respond to weakness in the labor market. For now, although the economy may be exhibiting signs of a soft landing, the longer it takes to reach a sustainable path to lower inflation, the more tenuous that scenario becomes.
Portfolio Strategy: A more important role for Diversifying Assets
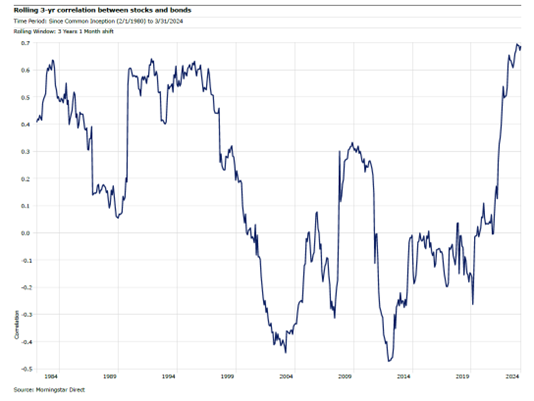
Between 2001 and 2020, stocks and bonds exhibited little to no correlation. In fact, the correlation during that time period was slightly negative. However, since 2020, the correlation has steadily climbed to reach an all-time high. While this higher correlation surprised investors in 2022, in a historical context, periods of higher inflation uncertainty have typically resulted in a tighter relationship between the two asset classes. Furthermore, cycles of higher stock-bond correlations can last years. The period between the mid-1970s and the late 1990s was a cycle of generally higher correlations.
If a new cycle has started, the role of diversifying assets in a well-balanced portfolio becomes even more valuable. Diversifying assets include strategies such as reinsurance, real assets, and alternative income. They exhibit low correlations to both stocks and bonds and therefore can help offset the lack of diversification created by a structurally higher stock-bond correlation.
After several months of due diligence, we will be adding a new diversifying fund into most client portfolios. This mutual fund invests in several unique and distinct underlying strategies that have exhibited little to no correlation to either stocks or bonds or to each other. The weighting will be approximately 2% of portfolio value. Our target allocation for diversifying assets overall is between 5% and 10%.
Please contact your TFC Advisor or us directly if you have any questions or would like to discuss your portfolio further. Thank you.
Sincerely,