
Mon, June 1, 2026
Global equities continued to rally on the back of strong earnings and a steady decline in oil prices and bond yields throughout the week.
Economic Data
First quarter GDP was revised down from 2.0% to 1.6% primarily due to a downgrade to inventories and a negative revision to consumption (from 1.6% to 1.4%). Fixed investment, particularly non-residential fixed investment (aided by data centers) contributed the most to growth in the first quarter.
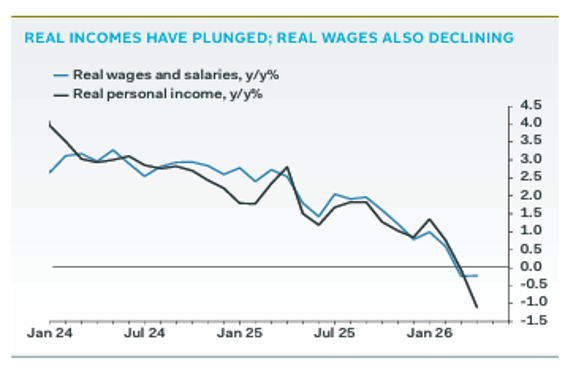
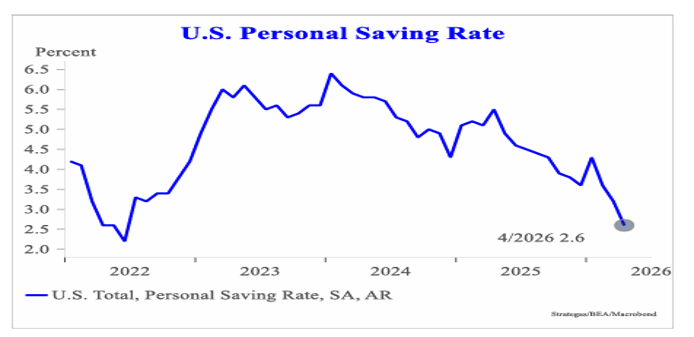
April personal income and spending data revealed that real (inflation-adjusted) personal income and wages have turned negative for the first time since 2022. Tax refunds have thus far helped to offset the effects of higher energy prices. This support will likely fade rapidly and may pressure what has been a resilient consumer. However, higher asset prices are likely to continue to support upper-income household spending.
The April Core PCE deflator (the Fed’s preferred metric) rose 3.3% year-over-year in April, a slight increase from March’s 3.2% pace. The deflator may linger around 3% for the next several months making it difficult for the Fed to cut interest rates.
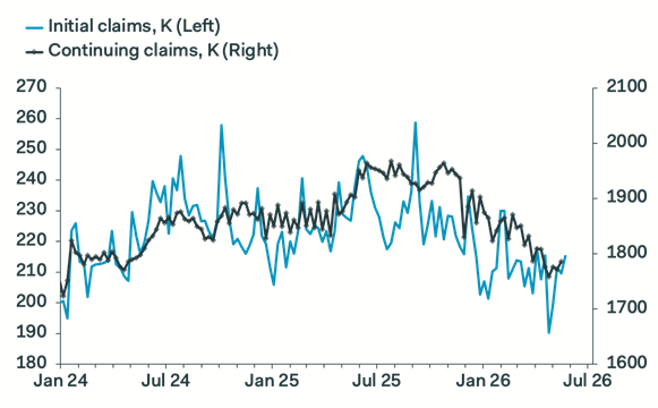
Weekly initial jobless claims and continuing claims rose slightly. The trend in both metrics is still benign and indicative of the “little hiring, little firing” trend we have seen over the last several months.
Markets
U.S. Equities
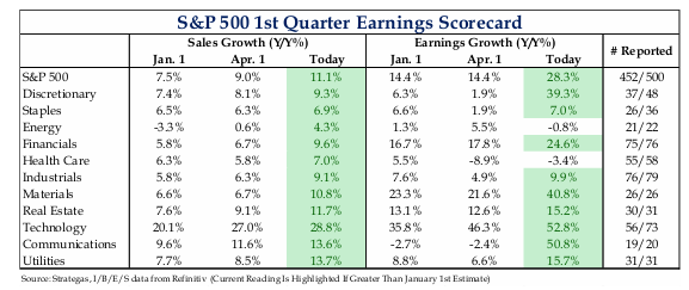
The S&P 500, Dow, and Nasdaq each hit all-time highs. Stocks were supported by lower oil prices and bond yields and continued strong corporate earnings reports. In fact, the Q1 earnings reporting period is shaping up to be one of the best in recent memory. The small company Russell 2000 also reached new highs. If there is a knock on the recent rally, it’s the lack of market breadth (participation). Since the bottom on 3/30, only one sector, technology, has outperformed the S&P 500. The Philadelphia Semiconductor Index has risen a staggering 65% this quarter. Breadth has been much better further down the cap spectrum.
International Equities
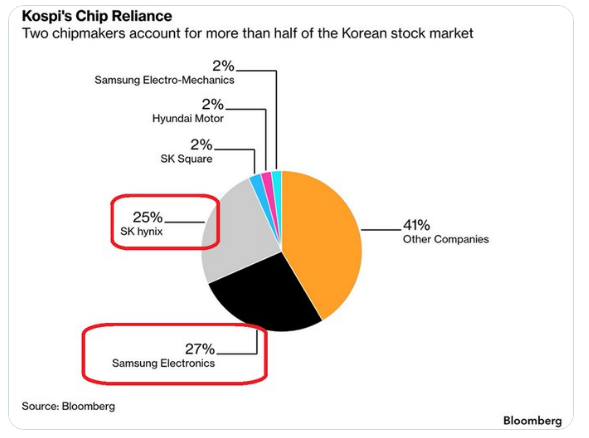
Developed and emerging markets stocks gained with the latter advancing nearly 4%. The semiconductor boom is no more evident than in the performance of emerging markets. Semiconductor stocks comprise a significant portion of the MSCI Emerging Market Index. The index has risen nearly 26% in Q2 on the back of just a handful of semi stocks based in South Korea and Taiwan (see chart of the week below). While it’s arguable if the US market is partying like it’s 1999, certain emerging markets appear to be. For example, we have heard that brokerages in South Korea can’t keep pace with the number of individual investors seeking to open margin accounts to leverage purchases of semiconductor companies.
The CSOP SK Hynix Daily 2x Leveraged ETF is now the world’s biggest single-stock leveraged product.
Fixed Income
The 2-year, 10-year, and 30-year Treasury yields retraced key levels they had breached just under two weeks ago. Yields have continued to track the movement in oil prices. Despite the pullback in oil prices, markets are still projecting one 0.25% increase from the Fed this year. Credit spreads have remained benign.
This Week
Look for several important economic data releases including Services and Manufacturing PMIs, Productivity, and the May employment report on Friday.
Chart of the Week
Two semiconductor companies now make up over 50% of the South Korean Kospi.
Written By Brian Presti
--
Brian Presti, CFA®, Chartered SRI Counselor℠, is Chief Investment Officer and a shareholder at TFC Financial Management. He oversees the firm’s investment strategy, asset allocation, and portfolio management processes and leads the firm’s Investment Committee. Brian specializes in portfolio construction, capital markets analysis, and sustainable and responsible investing. As CIO, he is responsible for evaluating investment managers and implementing portfolio strategies designed to support long-term client objectives.