
Mon, June 8, 2026
After several consecutive weeks of gains, Friday’s selloff in technology stocks led to a weekly decline in the S&P 500. Bond yields spiked after the better-than-expected May employment report.
Economic Data
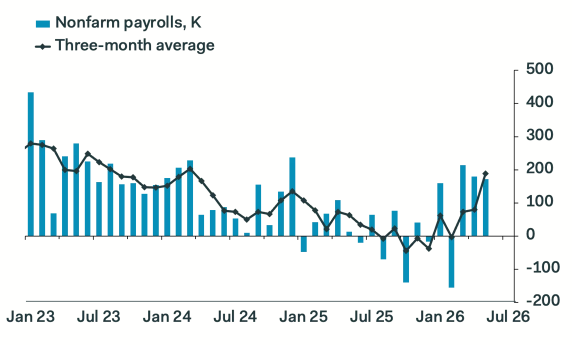
The most impactful release was the May jobs report. Job creation surprised to the upside for the third straight month. Payrolls grew 172k in May versus the estimate of 88k. The previous two months were revised up by a combined 93k. The three-month average of private payrolls has picked up to 166k -the highest since June of 2023. The unemployment rate remained at 4.3% while average hourly earnings were benign with year-over-year growth moderating to 3.4% from 3.6% in April.
Both the headline ISM Manufacturing and Services indices rose in May and exceeded expectations. The new orders components jumped in both indices as did the business activity index (ISM Services) and production index (ISM Manufacturing). Regarding the ISM manufacturing data, it’s likely there is some pull forward of demand as businesses seek to get ahead of supply disruptions due to the war.
Our Take
The economic data last week was broadly positive. We are in the camp that “good news is ultimately good news,” although the rise in yields and recalibration of monetary policy may cause volatility in the short term. During the week, two Fed officials broached the idea of rate hikes this year.
The U.S. economy will likely be a story of push and pull in the second half of 2026. Consumer spending is the key variable. While the job market appears to be perking up, real incomes are declining. Additionally, the tax refund season is over, potentially deflating a cushion against higher energy and commodity prices. The savings rate has already declined to 2.6%, the lowest since April of 2008.
Corporate profits are strong, which is fueling business spending and capex. The AI infrastructure buildout is accelerating (data center construction has recently surpassed all office construction) which should underpin growth. Our base case remains slower growth but not a recession. A wild card is a renewed climb in oil prices past the April highs.
Markets
U.S. Equities
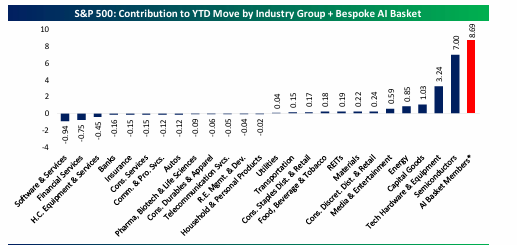
After nine straight weeks of gains, the S&P 500 declined 2.6%. Friday accounted for the entire weekly loss. The Nasdaq had its worst day since April 2025 while the Philadelphia Semiconductor Index suffered its largest daily decline since March of 2020. Last week we commented that if there was one knock on the recent rally, it was the extremely narrow breadth (lack of participation). To put into perspective how narrow the rally had been, the following chart shows the contribution of various sectors to the overall S&P 500 return before Friday. One sector certainly stands out!
Friday’s decline may simply reflect profit taking in areas of the market that had run too hard and too fast. Notably, selling was not indiscriminate. Five of the ten sectors in the S&P 500 were positive for the week. Investors rotated into healthcare, financials, consumer staples, energy, and select industrial stocks. Small companies fared slightly worse than large companies given their higher sensitivity to interest rates.
International Equities
Emerging market stocks lost ground last week with Asian benchmarks falling sharply in the overnight session. After a 25+% rally in the second quarter, this was not surprising. Last week we highlighted excessive sector concentration and growing speculation in select emerging markets.
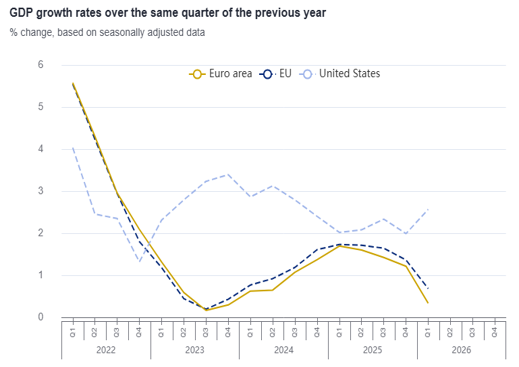
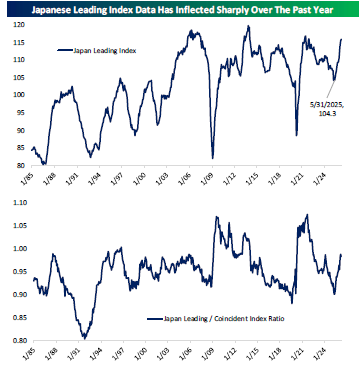
Q1 Eurozone GDP was revised down from quarter-over-quarter growth of +0.1% to -0.2%. This was the first contraction since Q4 2022. After an improvement in relative economic growth rates between the U.S. and Eurozone through most of 2025, growth rates have again diverged. We believe this divergence stems from Europe’s greater sensitivity to the effects of the war and the lack of underlying policy support (unlike in the U.S.) to act as a shock absorber for higher commodity prices and supply chain disruptions. Conversely, economic data continues to trend positively in Japan with wages rising, household spending picking up, and leading indicators accelerating.
Fixed Income
Fixed income volatility picked up on Friday as yields rose across the curve after the strong employment report. The jump in the 2-year yield was the most dramatic (from 4.05% to 4.15%), and the increasing gap between the 2-year yield and the Fed Funds rate suggests the Fed is falling further behind the curve (i.e. may need to hike rates).
According to CME FedWatch, Fed funds futures are now pricing in a 72% chance of one to three quarter point hikes by the end of the year, a 27% probability interest rates remain unchanged, and a 1% probability of a cut.
This Week
The most important economic releases are the May inflation data (CPI and PPI). Additionally, all eyes will be on the SpaceX IPO which debuts Friday. The SpaceX IPO is the first of three significant IPOs. Anthropic and OpenAI will likely debut later this year.
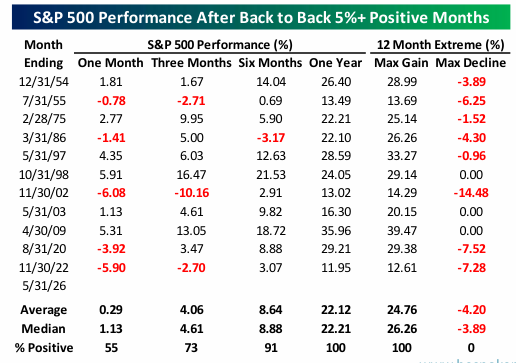
Chart of the Week
The S&P 500 posted back-to-back 5%+ monthly gains in May and June. This has only occurred 11 other times. Subsequent returns have historically been positive over the following 6 and 12 months but have been more mixed over one and three months.
Written By Brian Presti
--
Brian Presti, CFA®, Chartered SRI Counselor℠, is Chief Investment Officer and a shareholder at TFC Financial Management. He oversees the firm’s investment strategy, asset allocation, and portfolio management processes and leads the firm’s Investment Committee. Brian specializes in portfolio construction, capital markets analysis, and sustainable and responsible investing. As CIO, he is responsible for evaluating investment managers and implementing portfolio strategies designed to support long-term client objectives.