
Mon, June 29, 2026
The week was characterized by a volatile rotation within U.S. equities. The technology sector suffered one of its worst weeks in months, while value stocks and small and mid-sized companies advanced. Oil prices slid, and Treasury yields retreated from their recent highs.
Economic Data
The core PCE deflator rose 0.3% in May and 3.4% year-over-year. Both numbers were essentially in line with expectations. The core PCE deflator has been the Fed’s preferred inflation gauge since 2000 when former Federal Reserve Chair Alan Greenspan named it as such. The Fed has preferred this metric for two reasons. First, it covers a wider range of items across a larger swath of the population. Second, unlike CPI, which uses a fixed basket of goods and services, the deflator uses a chained index that allows for shifting consumer spending patterns and substitution effects. Admittedly, we don’t know if Federal Reserve Chairman Kevin Warsh will assign this metric the same level of importance as past chairs.
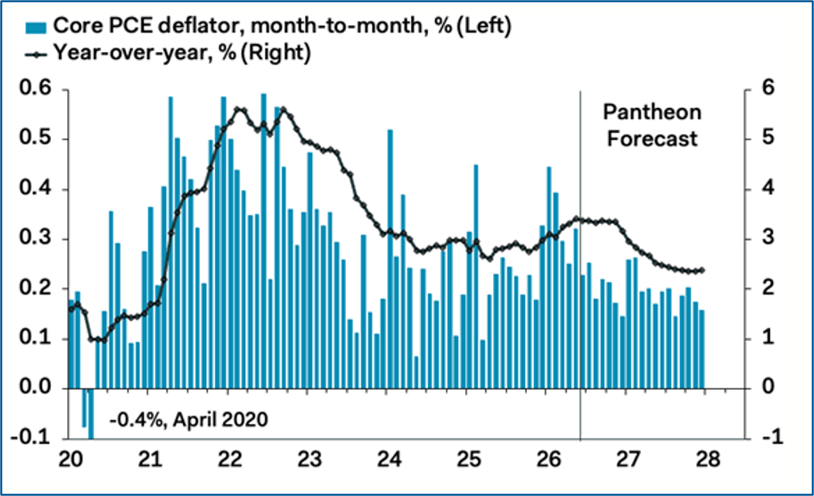
As with CPI, May could have marked the deflator’s high-water mark for the year. However, we expect the indicator to remain in the 3.0%+ range for the next few months keeping the Fed at least on hold.
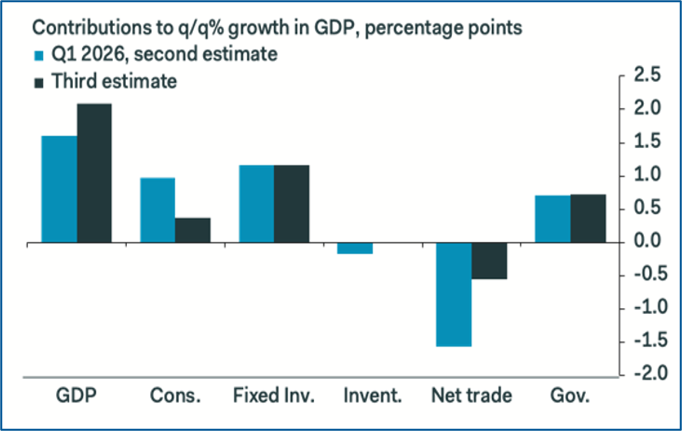
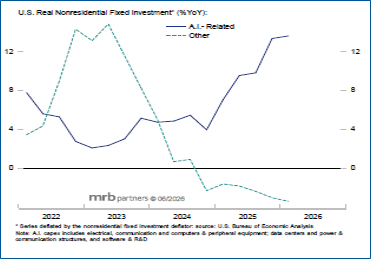
Q1 GDP growth was revised up from 1.6% to 2.1% although solely due to a lower drag from trade. Household consumption was revised down to just 0.5% from 1.4% in the second estimate. Noteworthy was the significant contribution from non-residential fixed investment. Overall fixed investment contributed 1.1%. However, if you strip out residential fixed investment (which declined during the quarter), non-residential fixed investment accounted for 1.4%. While this component includes several subcategories, the AI infrastructure buildout is the lion’s share (software, computer hardware, data centers). This contribution illustrates the growing influence (and potential risk) of the AI buildout on economic growth.
Markets
U.S. Equities
Last week’s market was very bifurcated. It was a rough week for large-cap technology and momentum stocks but a good week for value stocks and small to mid-sized companies.
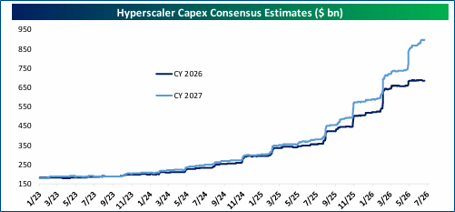
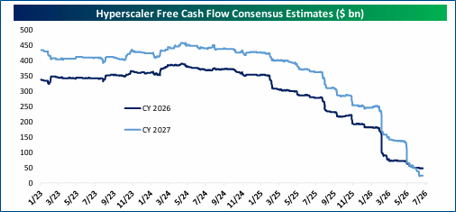
The declines in the technology sector were broader than we have witnessed in recent weeks. The hyperscalers (Microsoft, Alphabet, Amazon, Meta, and Oracle) continued to come under pressure. In addition to concerns about high levels of capex, debt and equity issuance, and deteriorating free cash flow, higher costs are now weighing on sentiment. The AI infrastructure buildout is leading to a structural shortage of high-bandwidth memory chips. Memory may consume 30% of hyperscalers’ AI data center capex in 2026, a 4x increase over 2023 and 2024. Semiconductor stocks also fell (Philadelphia Semiconductor Index down 8% for the week), leading to the worst week for the Nasdaq Composite since April of 2025.
The silver lining was that investors continued to rotate into other areas of the market. While the market-cap weighted S&P 500 fell 2%, the equal-weighted S&P 500 (a barometer of the average stock’s performance) rose 1.6%. Several sectors were positive, including healthcare which surged nearly 8%. Small and mid-cap benchmarks were positive for the week. As measured by Russell indexes, large-cap value stocks outpaced their growth counterparts by 3.68
International Equities
Developed and emerging market stocks fell by over 1% and 4% respectively. Japan led the decline within developed markets, while European markets were mixed. European markets have higher weightings in value stocks and more defensive sectors and tend to hold up better when AI-related companies are under pressure. However, this is typically not the case with emerging markets where the semiconductor heavy Taiwan and South Korean markets now make up nearly 50% of the entire MSCI Emerging Markets Index.
Fixed Income
Treasury yields declined across the curve. The 2-year yield has fallen nearly 0.15% from its post-Warsh press conference spike while the 10-year yield has declined about 0.20% from its high earlier in June. Oil prices have continued to fall and are close to pre-war levels. The effect of energy prices on inflation may have peaked in May. However, we are not out of the woods quite yet; core PCE is still running well above 3% annualized over the past month, 3 months, 6 months, and one year.
This Week
Economic data is skewed toward the labor market. We’ll receive updates on job openings and job cuts. The June employment report will be released on Thursday.
Chart of the Week
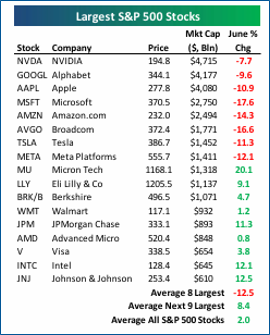
Rough June for the largest stocks:
As of last Friday, the 8 largest stocks in the S&P 500 are all down at least 7% this month.
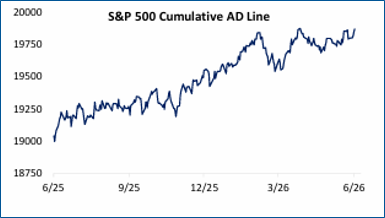
However, it was a good month for the average stock (aka “the rest of the market”). The S&P 500 cumulative advance/decline line reached a new high.
Written By Brian Presti
--
Brian Presti, CFA®, Chartered SRI Counselor℠, is Chief Investment Officer and a shareholder at TFC Financial Management. He oversees the firm’s investment strategy, asset allocation, and portfolio management processes and leads the firm’s Investment Committee. Brian specializes in portfolio construction, capital markets analysis, and sustainable and responsible investing. As CIO, he is responsible for evaluating investment managers and implementing portfolio strategies designed to support long-term client objectives.