
Mon, July 27, 2026
Global equities were mixed last week. U.S. stocks fell while international equities had modest gains. Brent crude oil revisited $100 per barrel as the war with Iran escalated. Yields in the U.S. rose across the curve with the 10-year treasury yield touching its highest level since early 2025.
Economic Data
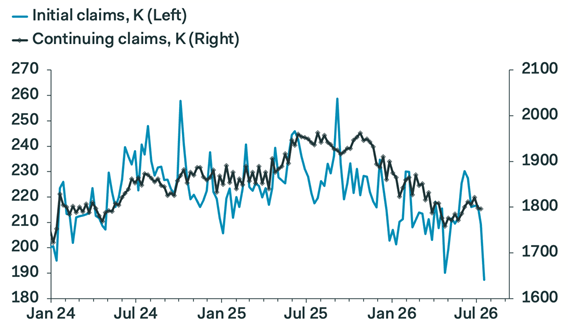
It was a light week for economic data releases. The most noteworthy data point was the sharp decline in weekly initial jobless claims. Weekly claims fell to 187,000, the lowest reading since 1969.
The S&P Global Flash U.S. Composite PMI (reflecting both services and manufacturing) rose to an eight-month high in July. Based on this reading, growth in real final sales to domestic purchasers (a good barometer of “core” GDP) may be running at 2.5% in Q3-a stronger pace than the 1.7% expansion in Q1 but weaker than the estimated 3%+ growth rate in Q2. Still, the evidence points to an economy that thus far has remained resilient despite the effects of the war. However, the report also revealed growing price and supply chain pressures. Supplier delays were the most severe since 2022 while input cost inflation rose to a 14-month high.
Slowdown in consumer spending? Real-time data (e.g. Johnson Redbook Same Store Sales, Bloomberg Consumer Spending Index, card transactions for consumer discretionary companies) suggest a broad-based slowdown in July.
Markets
U.S. Equities
Earnings season is in full swing. Alphabet was the first hyperscaler to report, providing investors fresh insights into the company’s capex projections and AI monetization progress. While the headline numbers appeared strong, investors frowned on the increased capex guidance as well as the company’s negative free cash flow. According to Factset data, this was the first time the company has reported a quarter of negative free cash flow since Google went public in 2004. The concerns led to a broader selloff in technology on Thursday, although the sector finished the week with a slight gain.
Outside of technology, earnings supported gains in healthcare and industrial stocks. Energy stocks rallied with higher oil prices. Despite the 0.6% weekly decline in the S&P 500, six of the ten sectors were positive for the week. The Russell 2000 index of small companies fell just over 1%.
While we’re still early in the earnings reporting season, thus far the trend has been a higher percentage of companies beating sales and earnings estimates relative to history.
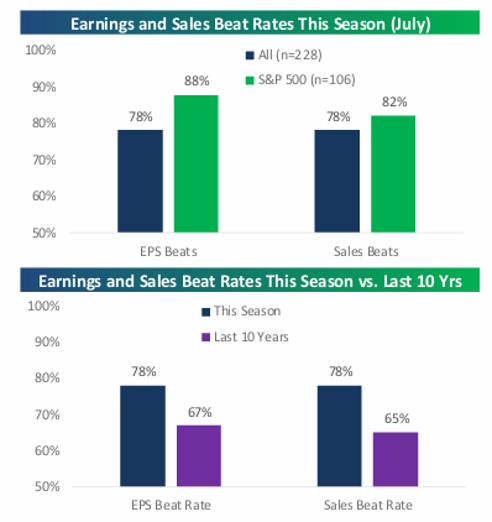
However, actual stock reactions to earnings have been weaker. According to Bespoke, the average gain for the 21 stocks that have beaten sales and earnings estimates and also raised guidance was 3.7%, about half of the gain of last quarter. Moreover, 9 of those 21 stocks declined with five falling 4% or more after reporting. This trend suggests a higher bar for earnings expectations this quarter.
International Equities
Most developed markets rose during the week. The European Central Bank kept interest rates on hold but left the door open for an additional hike in September. The MSCI Emerging Markets Index rose 0.49% led by a strong week in China.
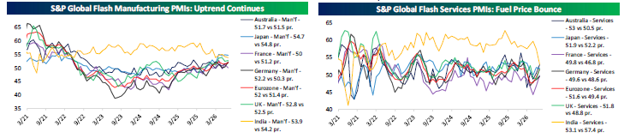
The flash readings for S&P Global Purchasing Manager Indices (PMI) were broadly positive. Most manufacturing and services PMIs were stable or accelerated from May to June.
Fixed Income
Yields rose across the curve. The 10-year treasury yield touched 4.70%, the highest level since early 2025. The 30-year yield is experiencing its longest run above 5% since 2007. The probability of one or more 0.25% interest rate increases through the September meeting rose to 80%.
This Week
This is shaping up to be an important week for markets. Earnings will be front and center, particularly reports from several mega-cap technology companies (Microsoft, Meta, Amazon, and Apple). Additionally, the Fed will conduct its two-day policy meeting. We’ll get important economic data (Core PCE, Q2 GDP), and investors will assess the war with Iran for continued signs of de-escalation after this past weekend’s events.
Chart of the Week
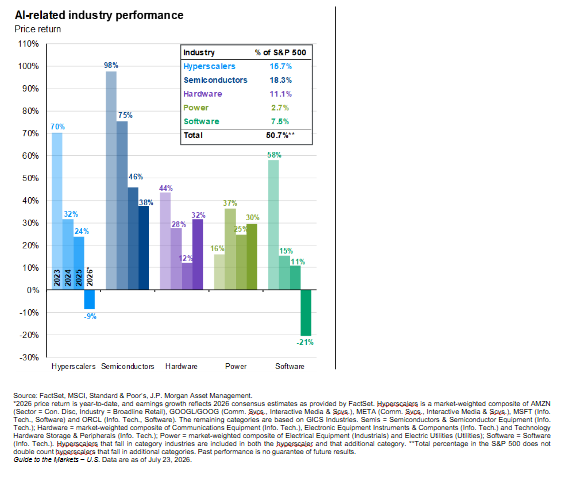
AI: Bifurcation and Concentration
AI-related industries comprise a significant percentage of the S&P 500’s market cap. Moreover, performance has become increasingly bifurcated between the industry groups, especially in 2026. Near-term beneficiaries of AI investment (semiconductors, hardware) have been the relative winners, while hyperscalers (concerns over capex/monetization) and software (competition) have been the relative laggards.
Written By Brian Presti
--
Brian Presti, CFA®, Chartered SRI Counselor℠, is Chief Investment Officer and a shareholder at TFC Financial Management. He oversees the firm’s investment strategy, asset allocation, sustainable responsible investing, and portfolio management processes and leads the firm’s Investment Committee. Prior to joining TFC in 2023, Brian was Director of Portfolio Strategy at The Colony Group, Chief Investment Officer of Harvest Capital Management and an equity analyst and portfolio manager with DL Carlson Investment Group. He began his career in 1997. As CIO, he is responsible for evaluating investment managers and implementing portfolio strategies designed to support long-term client objectives.